
The UK appears to be relying on property or property related taxes and the trend for this is rising compared to the OECD average, Germany and the United States. The opposite is happening with income from income and profits with tax take reducing when compared to GDP comparison factors and total tax revenue.
Since the 1960's the OECD has been working with governments across the world and they use the shared data and findings to make comparisons and predict trends for the future. Standards are set by the OECD and this includes tax.
A recent data release (period from 1990 to 2016) shows statistics on tax revenue comparing every country in the OECD directly as well as against the OECD average.
36 countries are members of the organisation from developed to emerging economies, however notable exceptions are China, India and Brazil.
There were two data releases:
- Tax to GDP ratio (including subcategories for particular taxes such as goods/services tax, income/profits tax, payroll tax, property tax and social taxes).
- Share of total tax revenue (also including subcategories for particular taxes such as goods/services tax, income/profits tax, payroll tax, property tax and social taxes).
Data is directly comparable against each country and shows changes across time from 1990 to 2016.
Looking at economical statistics since the Conservatives took power (2010 onward) shows the following for the United Kingdom when compared to OECD averages:
- Tax to GDP ratio dipped compared to OECD until 2014, whereas OECD has shown steady growth.
- Income/Profit taxes as a ratio of GDP fell until 2014 and are now climbing.
- The UK has lower social contribution as a ration of GDP than OECD (Although this is historically the trend since 1990).
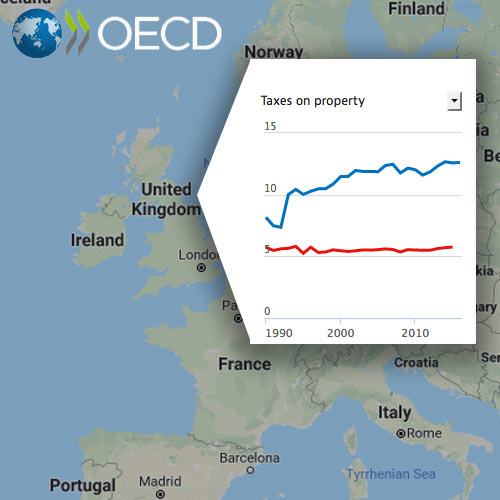
- Taxes on property are a higher proportion of GDP than OECD.
- Income/Profit taxes make up a higher percentage of total taxes than OECD.
- Social contributions make up a lower percentage of total taxes than OECD.
- Taxes on property are double the OECD when comparing share of total tax revenue.
Looking at economical statistics since the Conservatives took power (2010 onward) shows the following for the United Kingdom when compared to Germany:
- Germany has had a steady growth in tax revenue has a share of GDP since 2010, whereas the UK dropped until 2014 and is now growth but still lower overall than Germany.
- The UK and Germany have similar tax take and trends as a percentage of GDP on goods and services.
- GDP ratio of tax on income/profits fell to match Germany from 2010 and has been closely linked since 2014.
- Germany takes over double in GDP share when comparing social contributions compared to UK.
- The UK takes more in tax as a percentage of total tax take from goods as services than Germany although both countries have falling revenue from this particular category of tax.
- The UK takes more in tax as a percentage of total tax take from income/profits than Germany and both countries have a slight rising trend.
- Social contributions make up double the percentage of total tax revenue in Germany when compared to the UK.
- Tax on property contributes four times as much to total tax revenue in the UK than in Germany - and it was rising in the UK until 2014.
Looking at economical statistics since the Conservatives took power (2010 onward) shows the following for the United Kingdom when compared to the United States:
- Tax makes up a lower percentage of GDP in the US than in the UK - but it is is rising in the UK compared to the US.
- The UK takes double the tax to GDP ratio compared to the US on goods and services.
- The US has marginally higher tax to GDP ratio on income/profits compared to the UK.
- Social contributions as a ratio of GDP are similar for the US and UK.
- Property tax as a percentage of GDP is higher in the UK than in the US and rising, whereas the opposite is occurring in the US.
- From goods and services, the UK takes double the amount of tax when compared to the US (Compared to total tax take).
- The US takes more in total taxes from income/profits than the UK and this is rising - the UK's total tax take from income/profits compared to other taxes is dropping.
- Social contributions as a percentage of total tax take are higher in the US.
- Tax revenue from property (compared to all tax take) is higher in the UK compared to the US and growing - the opposite is occurring in the US.
The full charts can be viewed at: http://www.oecd.org/tax/tax-policy/global-revenue-statistics-database.htm