


HMRC conduct an annual survey into the personal incomes of UK taxpayers based on the three computer systems they hold information on, including PAYE and Self Assessment. Samples of data are extracted in order to create the published statistics, the most recent being from the 2015/2016 tax year.
Key statistics included were:
- 31 million taxpayers, 57 percent male (17.8 million) and 43 percent female (13.2 million).
- Total income disclosed was £1.04 trillion and tax liability on the income £178 billion.
- Average UK incomes were, mean £33,400 and median £23,200 - an increase of around £1,600 on the year before.
- Average UK tax paid was, mean £5,750 and median £2,350 - an increase of around £320 on the year before.
- Here are incomes for the UK since 1992:
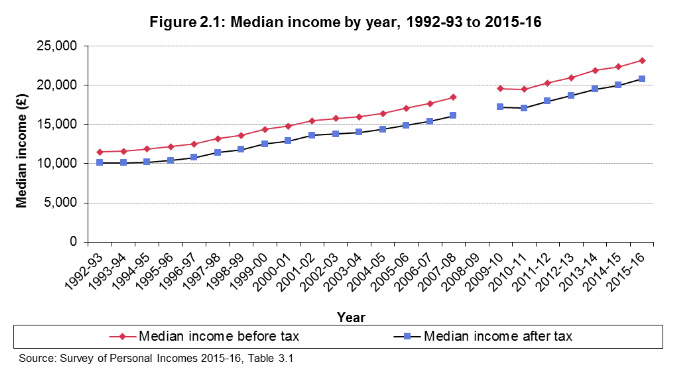
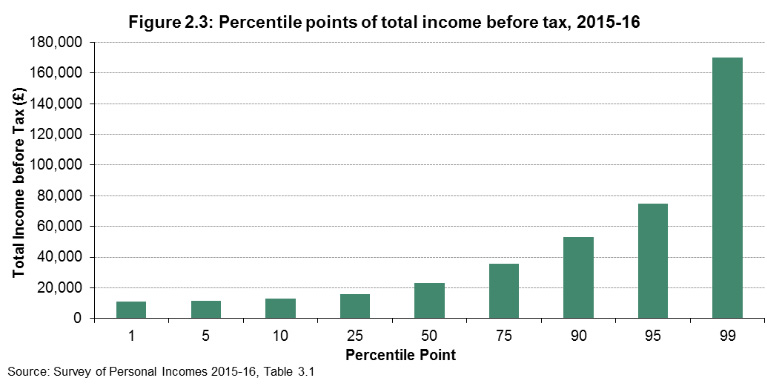
- 10 percent of taxpayers had an income below £12,800, median income was £23,200 and top 10 percent of taxpayers earned more than £53,100 - the full spread is below:
- UK self employment income was £81.6 billion (8%), employment income was £697 billion (67%), pension income was £147.9 billion and other sources including property, interest and dividends was £110 billion (11%).
- Pensioners made up 22 percent of taxpayers (6.87 million) and 17 percent of all income (£176 billion). 56 percent male (3.87 million) earning £110 million and 44 percent female (3 million) earning £66 billion.
- The South East region has the largest amount of pensioner taxpayers (1.1 million) earning £31.6 billion.
- Northern Ireland conversely has the smallest amount of pensioner taxpayers (134k) earning £3.31 billion.
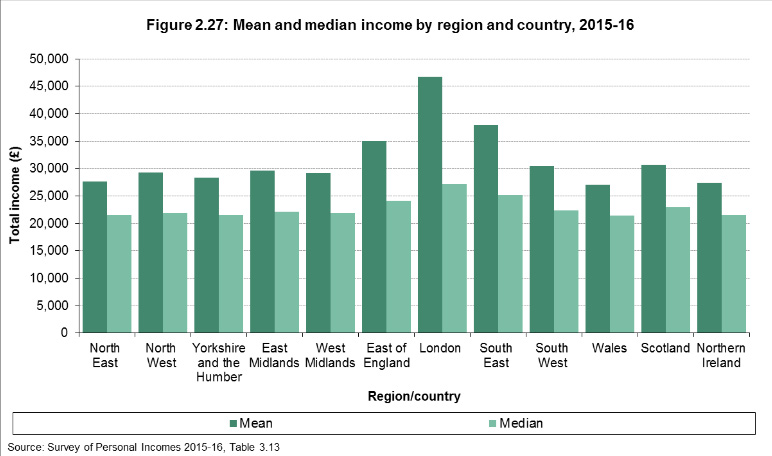
- Median income was highest in London at £46,700.
- Mean income was highest in London at £27,200.
- Second highest was the South East region (median £25,200, mean £37,900).
- Full spread of income by region:
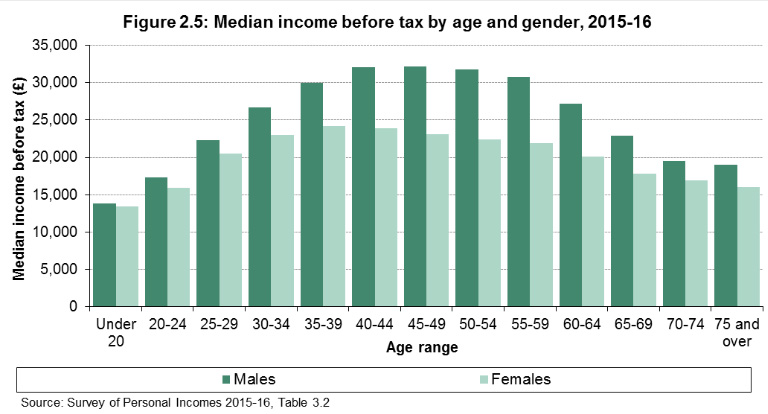
- Below is a chart of how incomes are spread amongst the age groups and sexes. Male incomes peak at age 45-49 at £32,200 (median), whereas female incomes peak at age 35-39 at £24,200 (median):
- London paid the highest mean (£10,500) and median (£3,090) in income related taxes.
- From all counties, Surrey had the highest mean and median total income (£49,800, £29,200), followed by Buckinghamshire (£46,900, £28,100) and Hertfordshire (£42,700, £27,300). Surrey paid the most tax of all counties (mean: £11,400, median: £3,350).
- Looking at boroughs/districts, Kensington and Chelsea had the highest average total income at £178,000, followed by City of London at £142,000 and Westminster at £109,000.
- Highest median income from boroughs/districts were recorded in City of London at £60,000, Westminster £37,800 and Kensington and Chelsea at £37,500.
- The UK has 3.4 million self employed individuals earning a median income of £13,100 and a mean income of £24,200.
- There are 23.3 million UK PAYE employed taxpayers earning a median income of £21,900 and a mean income of £29,800.
- There are 8.65 million pension income recipients in the UK earning a median pension of £14,300 and a mean pension of £17,100.
- 26.5 million individuals have income from other sources including property, interest and dividends. The mean income is £4,100, the median is £34.
- The UK has 498,000 self employed pensioners (avg income £13,600), contrasted to 1.52 million PAYE taxpaying pensioners (avg income £13,950). 6.78 million pensioners had a total pension income of £1.26 billion (avg income £18,600).
- 6.6 million pensioners had £22.7 billion income from combined property, interest, dividend and other income (avg income £3,420).
- Compared to the year before taxpayer numbers have increased by 300,000 (200k male, 100k female). Total income has risen by £63 billion and tax receipts increased by £11 billions.
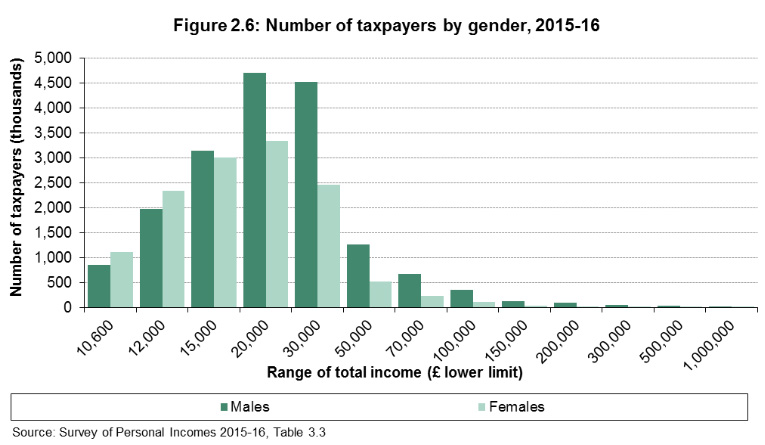
- Most taxpayers are earning between £20,000 and £30,000, regardless of sex. Here is the full spread:
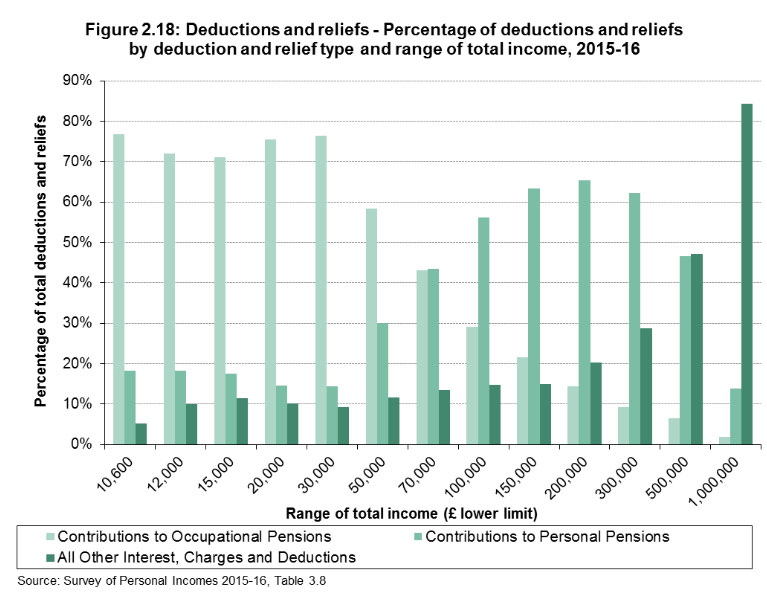
- Up to £70,000 of income, the highest proportion of tax reliefs and deductions claims from total income are occupational pension contributions. Over £70,000 of income contributions to personal pensions take hold as well as growth in other deductions. Here is the full chart:
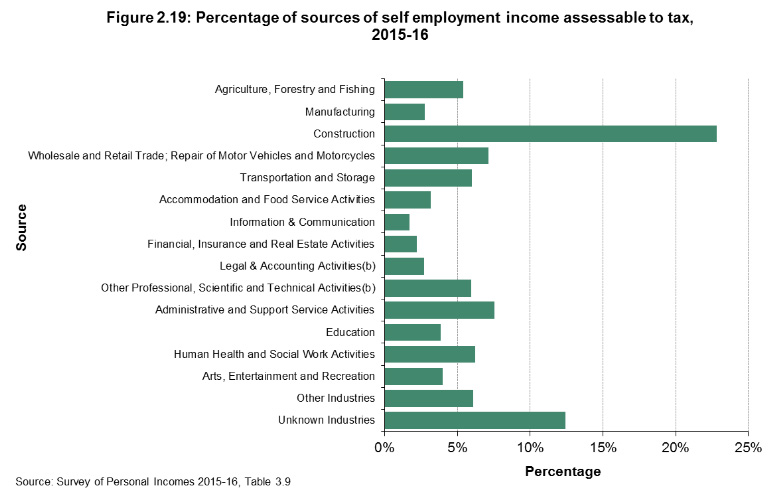
- The highest percentage category of self employment income was from construction:
Read our guide to graduate salaries for an interesting comparison of degree subject to graduate salary - including a calculator to find affordable first home areas based on degree and location.