
Analysis of all Tax Returns submitted for the 2013/14 tax year period highlight some interesting patterns. HMRC normally release stats like these every year around the deadline time for the online Self Assessment and it's no different this year with just a few days to go now.
Statistics were provided on the sex, age range, area and industry of people submitting late Tax Returns. We have compiled the headline results below, along with the full tables further down. *Remember, the figures below show number of late returns per 10,000 submitted.
-
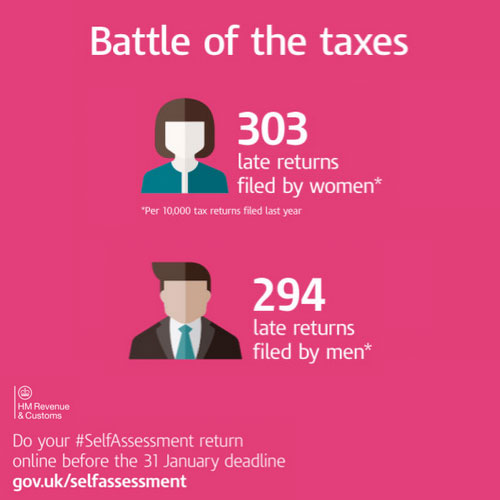
Women more likely to be late with their Tax Return than men.
Women submitted 9 more late returns per 10,000 than men.
-
18-20 year olds 9 times more likely to be late with their Tax Return than pensioners.
A staggering 949 late returns per 10,000 submitted by the youngsters with only 118 per 10,000 late by people over 65 years of age.
-
Admin staff more likely to be late with their Tax Return!
Astonishingly people working in Administrative and support services were the worst performing industry sector with 359 late tax returns per 10,000. Agriculture, Fishing and Forestry came top with only 71 late returns per 10,000. Lawyers were 2nd best and Finance, Insurance, Estate Agents 3rd.
-
Northern Ireland more punctual than England.
People in Northern Ireland had 223 late returns per 10,000. England had 297, Scotland had 291 and Wales 259. The average for the UK was 293.
-
London the worst region for late Tax Return submission.
Way above the UK average were London with 402 late Tax Return submissions per 10,000. The best region was the South West with 236.
Putting the above together would mean 18-20 year old women living in London and working in administration are most likely to submit their Tax Return late.
All of the late Tax Returns submitted received a £100 penalty instantly - well, unless they had a good excuse.
The full statistics (late tax returns per 10,000):
| Age Bracket | 2013-14 | 2012-13 |
| 18-20 | 949 | 1085 |
| 21-30 | 621 | 736 |
| 31-40 | 463 | 575 |
| 41-50 | 331 | 444 |
| 51-60 | 224 | 299 |
| 61-64 | 147 | 192 |
| 65+ | 118 | 155 |
| UK Region | 2013-14 | 2012-13 |
| Scotland | 291 | 391 |
| England | 297 | 374 |
| Wales | 259 | 346 |
| Northern Ireland | 223 | 301 |
| London | 402 | 512 |
| North East | 305 | 380 |
| North West | 295 | 369 |
| South East | 276 | 355 |
| East of England | 273 | 346 |
| West Midlands | 286 | 344 |
| Yorkshire and the Humber | 272 | 337 |
| East Midlands | 264 | 324 |
| South West | 236 | 299 |
| Industry | 2013-14 | 2012-13 |
| Agriculture, Forestry and Fishing | 71 | 109 |
| Manufacturing | 250 | 313 |
| Construction | 241 | 352 |
| Wholesale and Retail Trade; Repair of Motor Vehicles and Motorcycles | 247 | 309 |
| Transportation and Storage | 287 | 347 |
| Accommodation and Food Service Activities | 213 | 300 |
| Information and Communication | 330 | 390 |
| Financial, Insurance and Real Estate Activities | 212 | 286 |
| Activities Legal & Accounting Activities | 147 | 219 |
| Other Professional, Scientific and Technical Activities | 263 | 322 |
| Administrative and Support Service Activities | 359 | 388 |
| Education | 292 | 317 |
| Human Health and Social Work Activities | 239 | 262 |
| Arts, Entertainment and Recreation | 272 | 329 |
| Other Industries | 333 | n/a |